Almost everyone who holds more than one currency makes the same mistake, and almost nobody notices, because the mistake is invisible from inside the spreadsheet that contains it.
It goes like this. You have savings in euros and dollars. You want one number, so you put today's EUR/USD rate in a cell and multiply the euro column by it. Clean, simple, and wrong in a way that only shows up months later — when you look at your trend line and cannot work out why it never seems to say anything.
The problem is that one rate cell is doing two different jobs, and only one of them is legitimate.
The two ways to convert, and only one is right
There are exactly two things you can do with a foreign-currency balance from January.
Convert it at the rate that applied in January. This tells you what that money was worth, in your reporting currency, at the moment you are describing. January's number is then a permanent fact. It will read the same in five years as it does now.
Convert it at today's rate. This tells you what January's balance would be worth if you held it today — which is a strange, hypothetical quantity that nobody actually wants, and which changes every time the market moves.
The second is the default in every spreadsheet, because a spreadsheet has one rate cell and multiplies everything by it. So your entire financial history silently re-prices itself every morning.
What today's-rate-everywhere does to a trend line
Here is the smallest example that shows the damage.
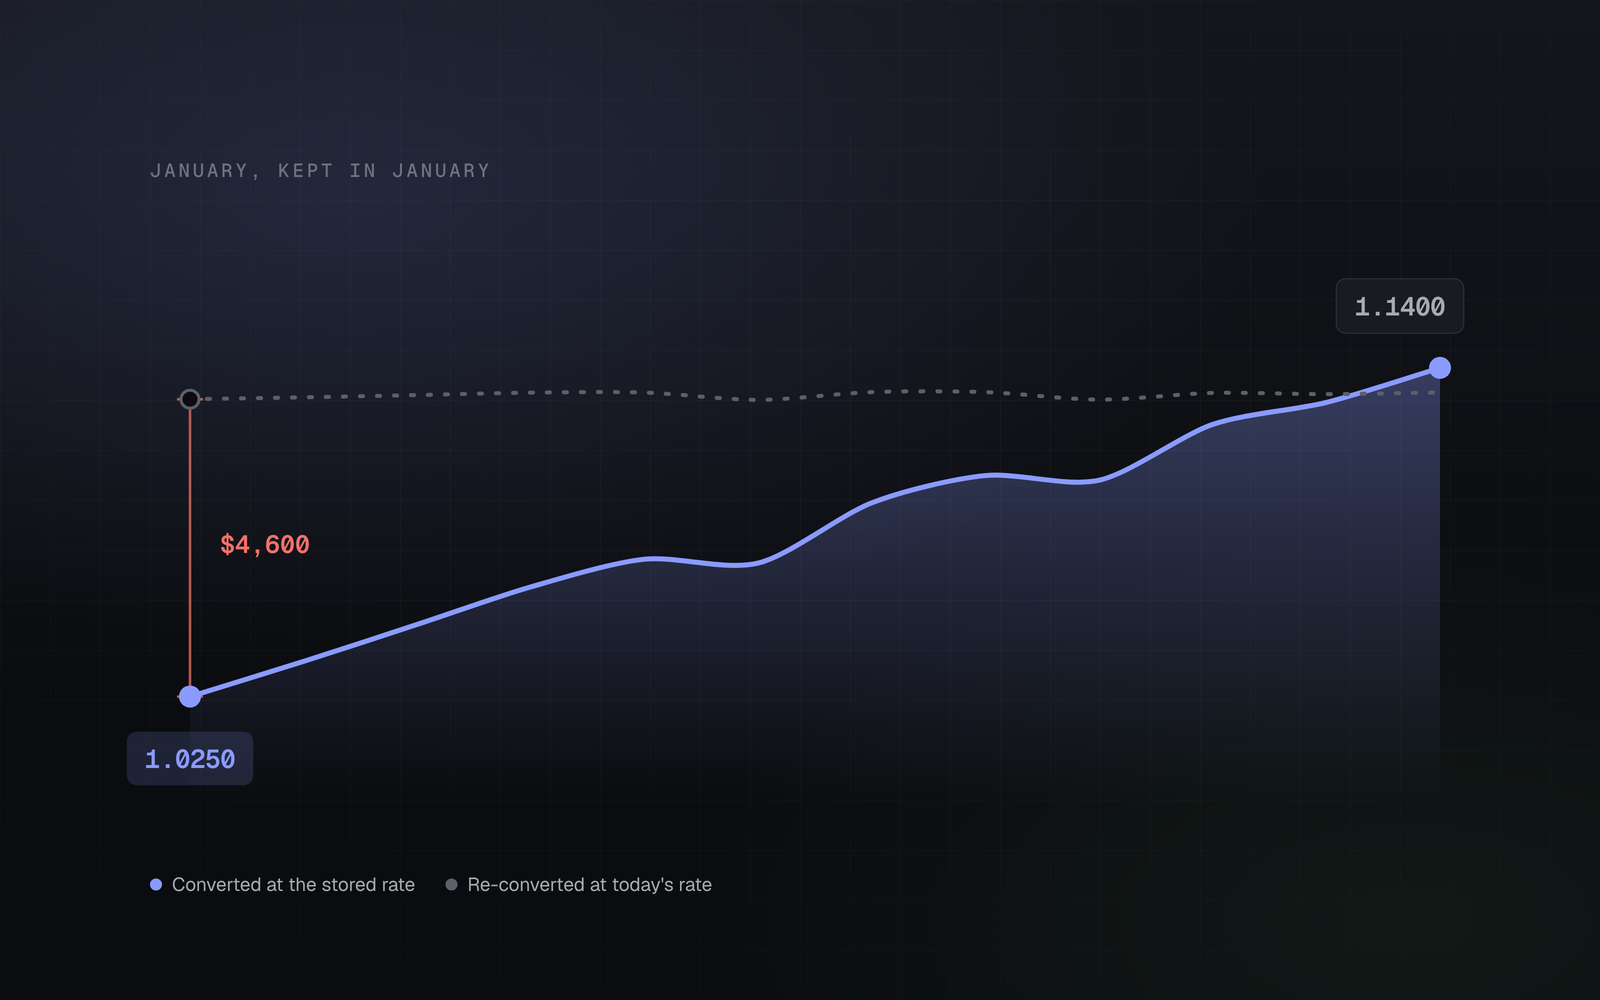
You hold €40,000 and $30,000, and you report in dollars. In January the rate was 1.0250; today it is 1.1400. Nothing moved in or out of either account all year.
- Converted at stored rates. January: €40,000 × 1.0250 = $41,000, plus $30,000 = $71,000. Today: €40,000 × 1.1400 = $45,600, plus $30,000 = $75,600. You are up $4,600.
- Converted at today's rate throughout. January: €40,000 × 1.1400 = $45,600, plus $30,000 = $75,600. Today: also $75,600. You are up nothing.
The euro leg genuinely gained $4,600 of dollar purchasing power this year. The second method erases it — not by rounding it away, but by retroactively pretending you always had it. And the error runs both ways: had the euro fallen, the same method would have invented a gain you never made, and it would have shown up in the month you were trying to evaluate a completely unrelated decision.
A financial history that changes overnight is not a history. It is a live re-rendering of the present, wearing dates.
Why the trend line never says anything
Which rate, exactly
Once you accept that you need a rate per date, the next question is which one — and here the honest answer is that it depends on what the number is for.
Mid-market rate on the date. The midpoint between buy and sell, the rate you see on a search engine. Right for valuing a balance you are holding. You are not selling those euros today; you just want a fair common unit.
The rate you actually got. Right for valuing a transaction. When you moved €5,000 and $5,340 arrived, your rate was 1.0680, whatever the mid-market said. That is not an approximation of the true rate — for that transfer it is the true rate, and the gap between it and mid-market is a real cost you paid.
Mixing these up is how people end up with a portfolio that quietly disagrees with their bank statements. Balances get the market's rate; movements get the rate the movement actually happened at.
The gap has a name and a size
The difference between mid-market and the rate you received is the provider's spread, and it is usually larger than the fee they show you. A transfer advertised at "0.4%" often costs 0.4% in visible fee plus 0.5–1.5% in spread. Recording only the fee makes cross-border money movement look about three times cheaper than it is — which is exactly the kind of error that survives for years because it never contradicts anything else in your records.
Conversion loss is an expense, not a rounding error
Follow the money through a single transfer. €5,000 leaves one account. $5,340 arrives in another. If you record only those two lines, your books say you spent €5,000 and received $5,340, and the difference between what those two are "worth" has to go somewhere — usually into a mysterious drift that you correct by hand once a quarter.
It belongs in a third line. Value the outgoing leg at the mid-market rate for that day (€5,000 at 1.0850 = $5,425), compare it to what actually landed ($5,340), and the $85 difference is an expense with a name: conversion loss. Book it and three things become true at once. Both account balances reconcile exactly. Your annual total for "money lost to moving money" becomes a real, quotable figure. And your net worth stops drifting for reasons you cannot explain.
Capital Wizard books that third row automatically on every cross-currency transfer, because the alternative — a transfer that silently changes your net worth — is the single most common source of "the numbers don't add up" that we hear about.
Picking a reporting currency
You need one currency to think in. Two rules make the choice easy.
Choose the one you spend in, not the one you earn in. If you are paid in dollars and live in Poland, your financial position is a złoty question. "Can we afford this" is always asked in the currency of the thing you are buying.
Then leave it alone. Switching your reporting currency mid-history is the one operation that legitimately rewrites every past number, and after doing it once you will no longer trust any of them. If you genuinely need both views, keep both — but keep them as two full histories, each with its own stored rates, not as one history with a toggle.
What this costs you in each tool
| Spreadsheet with one rate cell | Rates stored per snapshot | |
|---|---|---|
| Last January's total | Different every morning | Fixed forever |
| Year-on-year growth | Contaminated by FX drift | Separable: saving vs currency |
| Transfer fees | Invisible unless typed in by hand | A line item with an annual total |
| Balance reconciliation | Drifts, corrected manually | Matches the bank exactly |
| Effort per month | Re-check every rate cell | None; the rate is captured on the day |
None of this argues that you need software. It argues that you need one extra column — the rate, on the date — and the discipline to never overwrite it. A spreadsheet can do that perfectly well if you add the column now, while the history is short.
The reason it usually does not happen is that the column has to be filled in on the day, every day, forever, and the cost of forgetting is only discovered months later. That is precisely the sort of job worth handing to something that does not forget.
See your own number instead of reading about someone else’s.
Import a statement, add your accounts, and get a real net-worth figure in an evening. One month free, no card required.
Start free