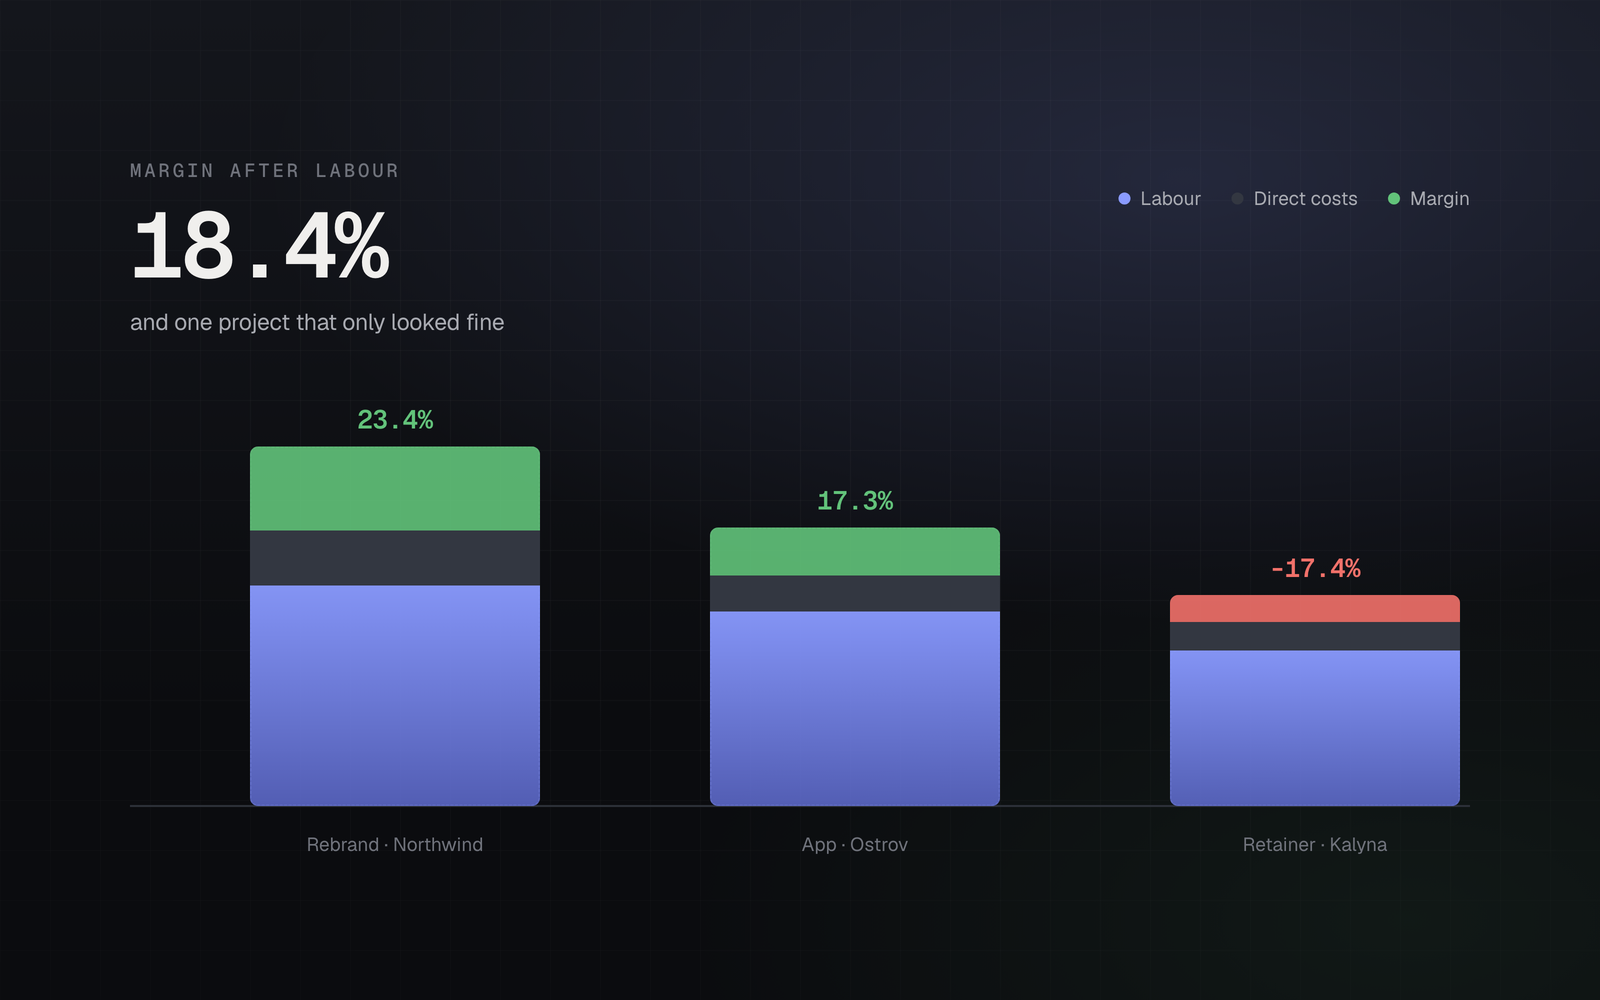
Ask a small studio which of their projects were profitable last year and you will usually get an answer within seconds. Ask how they know, and the answer is almost always the invoice total, sometimes minus a few obvious direct costs — a subcontractor, a licence, a trip.
The number that is missing is the largest one. In any people-based business, labour is 60–80% of the cost of delivery, and it does not appear on a bank statement in a form that can be attributed to a project. Salaries leave your account in one monthly lump. Your own time leaves no trace at all.
So the profitability question gets answered with the only data that is easy to get, and the answer is systematically wrong in one direction: every project looks better than it was, and the worst ones look best of all, because the projects that consumed the most unbilled hours are exactly the ones whose costs are least visible.
Revenue is easy. Cost is where projects hide.
Project cost comes in three layers, in descending order of how often they are tracked.
Direct external costs. Subcontractors, licences, hosting, travel. These are on a statement with a supplier name, and most people capture them. This is the layer everyone does.
Labour. The hours your team and you spent, valued at what those hours cost the business. This is the big one, and it is missing from most small-company records entirely — not because anyone decided to omit it, but because there is no document that reports it.
Overhead. Rent, tools, admin time, the accountant, the half of the year that anyone spends on things that are not billable. Real, and much harder to attribute.
You can build a genuinely useful picture with the first two and a crude version of the third. What you cannot do is skip the second, because it is the layer where projects differ most.
The two rates
The mechanism that makes labour trackable is simple, and it is the standard model in staff augmentation and agency work: every person has two hourly rates.
The cost rate is what an hour of that person costs the business. Salary plus employer contributions plus benefits, divided by realistically available hours — not 2,080 a year, but something closer to 1,600 once holiday, sick leave, training and the general friction of employment are removed. Using the full-year figure understates the cost of every hour by roughly a quarter.
The bill rate is what you charge a client for that hour.
Once both exist, a time entry stops being a timesheet row and becomes two numbers: a cost to you and a value to the client. The difference, summed across a project, is your labour margin, and it is available continuously rather than at the end.
Rates change — people get raises, and you reprice clients. So a rate needs a date range, and a time entry must be valued at the rate in effect on the day it was logged. Applying today's rate to last year's hours produces the same class of error as converting your financial history at today's exchange rate: the past moves, and comparisons across time stop meaning anything.
A crude overhead loading beats none
Overhead attribution is where people give up, because doing it properly requires cost accounting that a ten-person company has no business attempting.
The pragmatic version: take last year's total overhead, divide by last year's total billable hours, and you have an overhead cost per billable hour. Add it to each person's cost rate. Recalculate annually. It is approximate, it treats an expensive person and a cheap one as carrying the same overhead, and it is enormously better than zero — because zero is not neutral, it is a claim that overhead is free, and it always flatters the projects that took longest.
We got this wrong ourselves
Early on, our project labour totals read as zero for a handful of large projects, and it took an embarrassing amount of time to find out why: the underlying query was fetching time entries without pagination, and the database was capping the result at 1,000 rows. Projects under the cap were correct. Projects over it silently lost everything past the first thousand entries — and a rollup that undercounts always looks plausible, because there is nothing to compare it against. If you build any of this yourself, test it on your largest project, not your newest one.
Utilisation is not profitability
Two metrics get confused constantly, and treating them as the same thing is how a fully-booked business goes broke.
Utilisation is the share of available hours that were billable. It measures how busy you are.
Realisation is the share of billable hours that were actually invoiced and paid. It measures whether being busy turned into money.
A team at 90% utilisation and 65% realisation is working flat out and giving away a third of it — in scope creep, in rework, in hours written off at invoicing time because nobody wanted the conversation. That gap is invisible unless the hours are logged whether or not they get billed, which is the single most important rule in time tracking and the one most often broken. Log the hour that you know you will not bill. It is the only record you will ever have of what that client actually costs.
A project that came in at twice the estimate and was invoiced at the estimate did not "go slightly over". It halved its own margin, and nothing in your accounts will ever say so.
The cost of unlogged hours
Four questions worth being able to answer
Everything above exists to make these answerable in under a minute:
- Margin by project. Which work was actually worth doing. Expect a wider spread than you assume — a common shape is that the top two or three projects earn nearly all the profit and one or two are loss-making.
- Margin by client, across projects. More useful than per-project, because clients are consistent: the one who was difficult last time will be difficult again.
- Estimate versus actual hours. Your estimating error, per project type. Knowing you run 40% over on a particular kind of work is worth more than any pricing model.
- Revenue per available hour. The one number that combines rate, utilisation and realisation. If it is flat while you are getting busier, growth is costing you money.
What each level of tracking can tell you
| You track | You can answer |
|---|---|
| Invoices only | What you billed |
| Invoices + direct costs | Which projects had expensive suppliers |
| + hours at cost rate | Which projects made money |
| + hours logged whether billed or not | Which clients are expensive to serve |
| + overhead loading | Whether the business as a whole is viable at these prices |
None of this requires an ERP. It requires that hours get logged against a project, that people have a cost rate with dates on it, and that the arithmetic happens somewhere other than in a spreadsheet rebuilt each quarter. That is roughly a week of setup and a few minutes a day — and it is the difference between having opinions about which clients are worth keeping and having evidence.
See your own number instead of reading about someone else’s.
Import a statement, add your accounts, and get a real net-worth figure in an evening. One month free, no card required.
Start free